24.1.4. Challenge Results
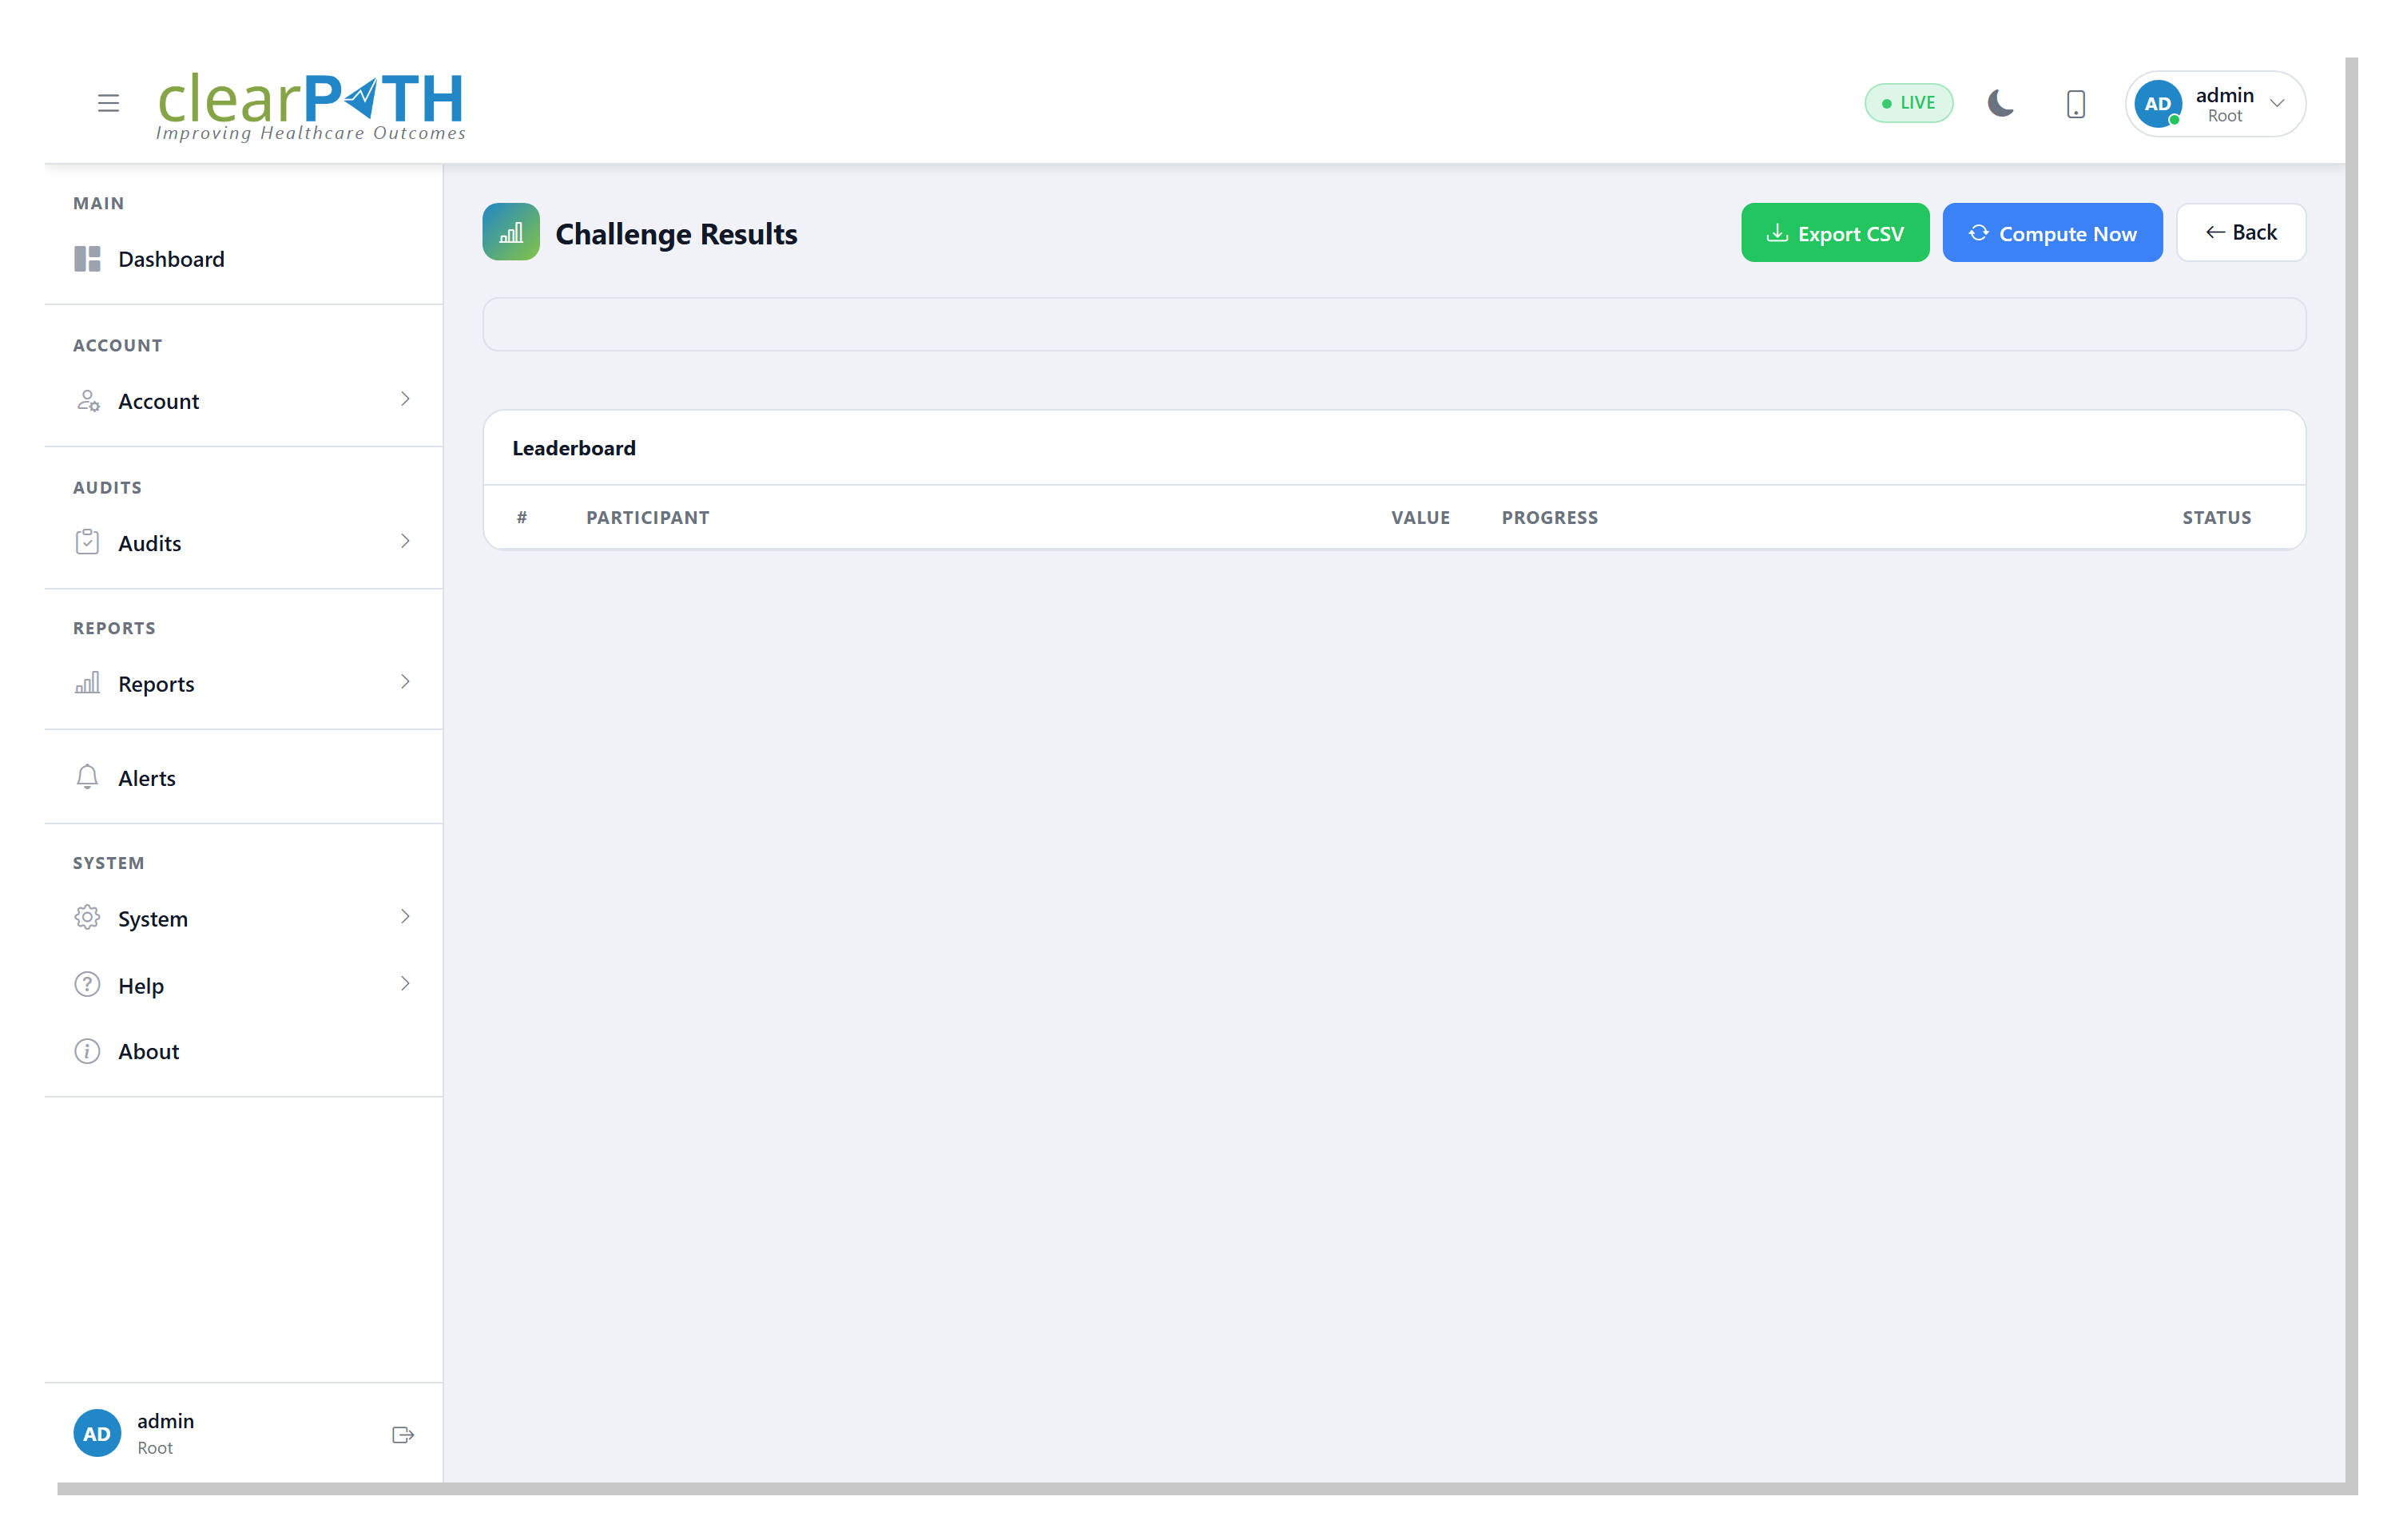
The Results page is a per-challenge leaderboard that shows, for every participant in scope, how they scored and whether they met the goal.
24.1.4.1. Opening the page
From Challenges List click View Results on any row.
Direct URL:
challenge.results.html?id=N.
24.1.4.2. Reading the table
Each row represents one participant in scope. Columns:
Column |
Meaning |
|---|---|
Participant |
Name of the facility, unit, auditor, HCP type, or team that was scored. |
Metric Value |
The raw score: count, compliance %, improvement delta, or streak days – whichever metric the challenge uses. |
Met |
Green check if |
Computed At |
Timestamp of the most recent compute. All rows share the same timestamp because compute overwrites the snapshot atomically. |
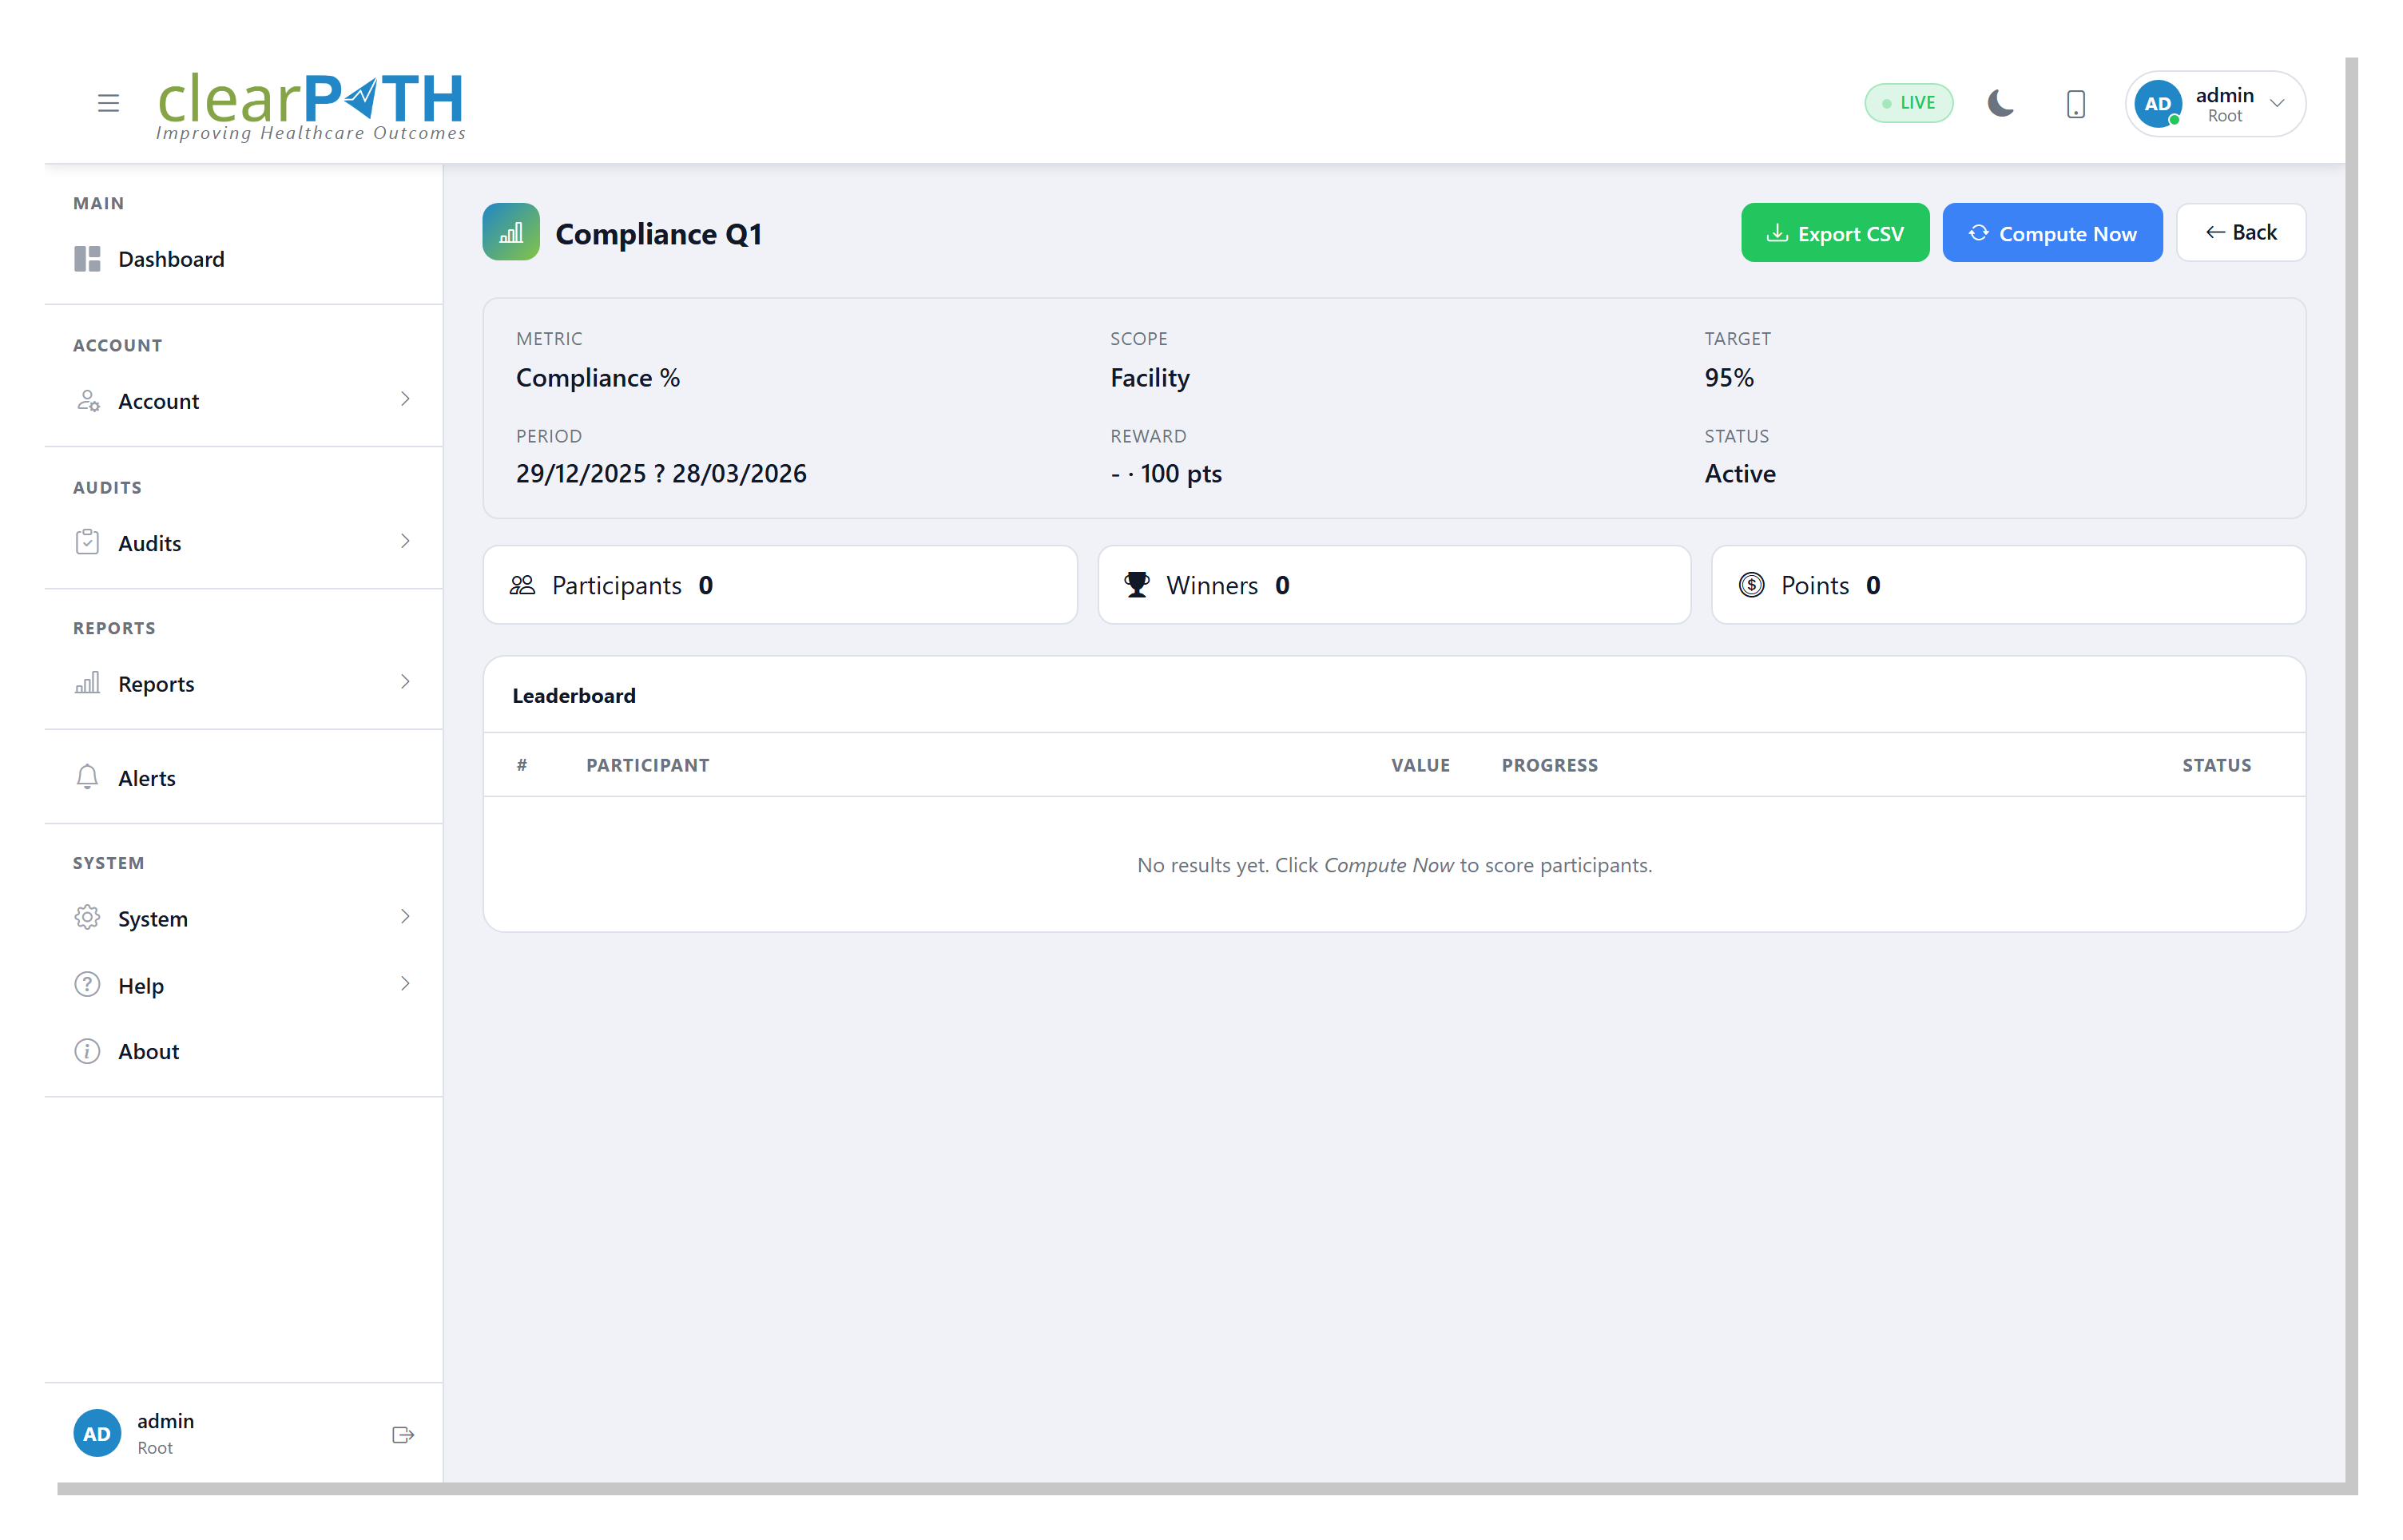
24.1.4.3. Sorting and filtering
Click any column header to sort. Default is winners first, then metric value descending.
The search box filters the participant name.
Use Export CSV to download the full leaderboard for further analysis.
24.1.4.4. Preview vs. final
The results table always shows the most recent compute snapshot, not necessarily the “final” snapshot. A useful sanity-check workflow:
Compute Now on Challenges List to refresh the snapshot.
Open View Results – confirm the numbers look right.
Return to the list and Preview Close to see who would be awarded and how many points.
Only when satisfied, Close Challenge.
24.1.4.5. After Close
Once a challenge is closed, every met = 1 row in this table has a corresponding entry in the
points ledger and (if a badge was configured) in the badge grants table. You can navigate to a
specific participant’s history by clicking their name – this opens their
Participant Profile.