33. Alerts
Alerts give you a single place to review system events that need attention — things like service warnings, configuration issues, and informational notices raised by clearPath. The Alerts area is available to root and administrator accounts.
To open the alerts list, go to Analytics | Alerts | Active Alerts.
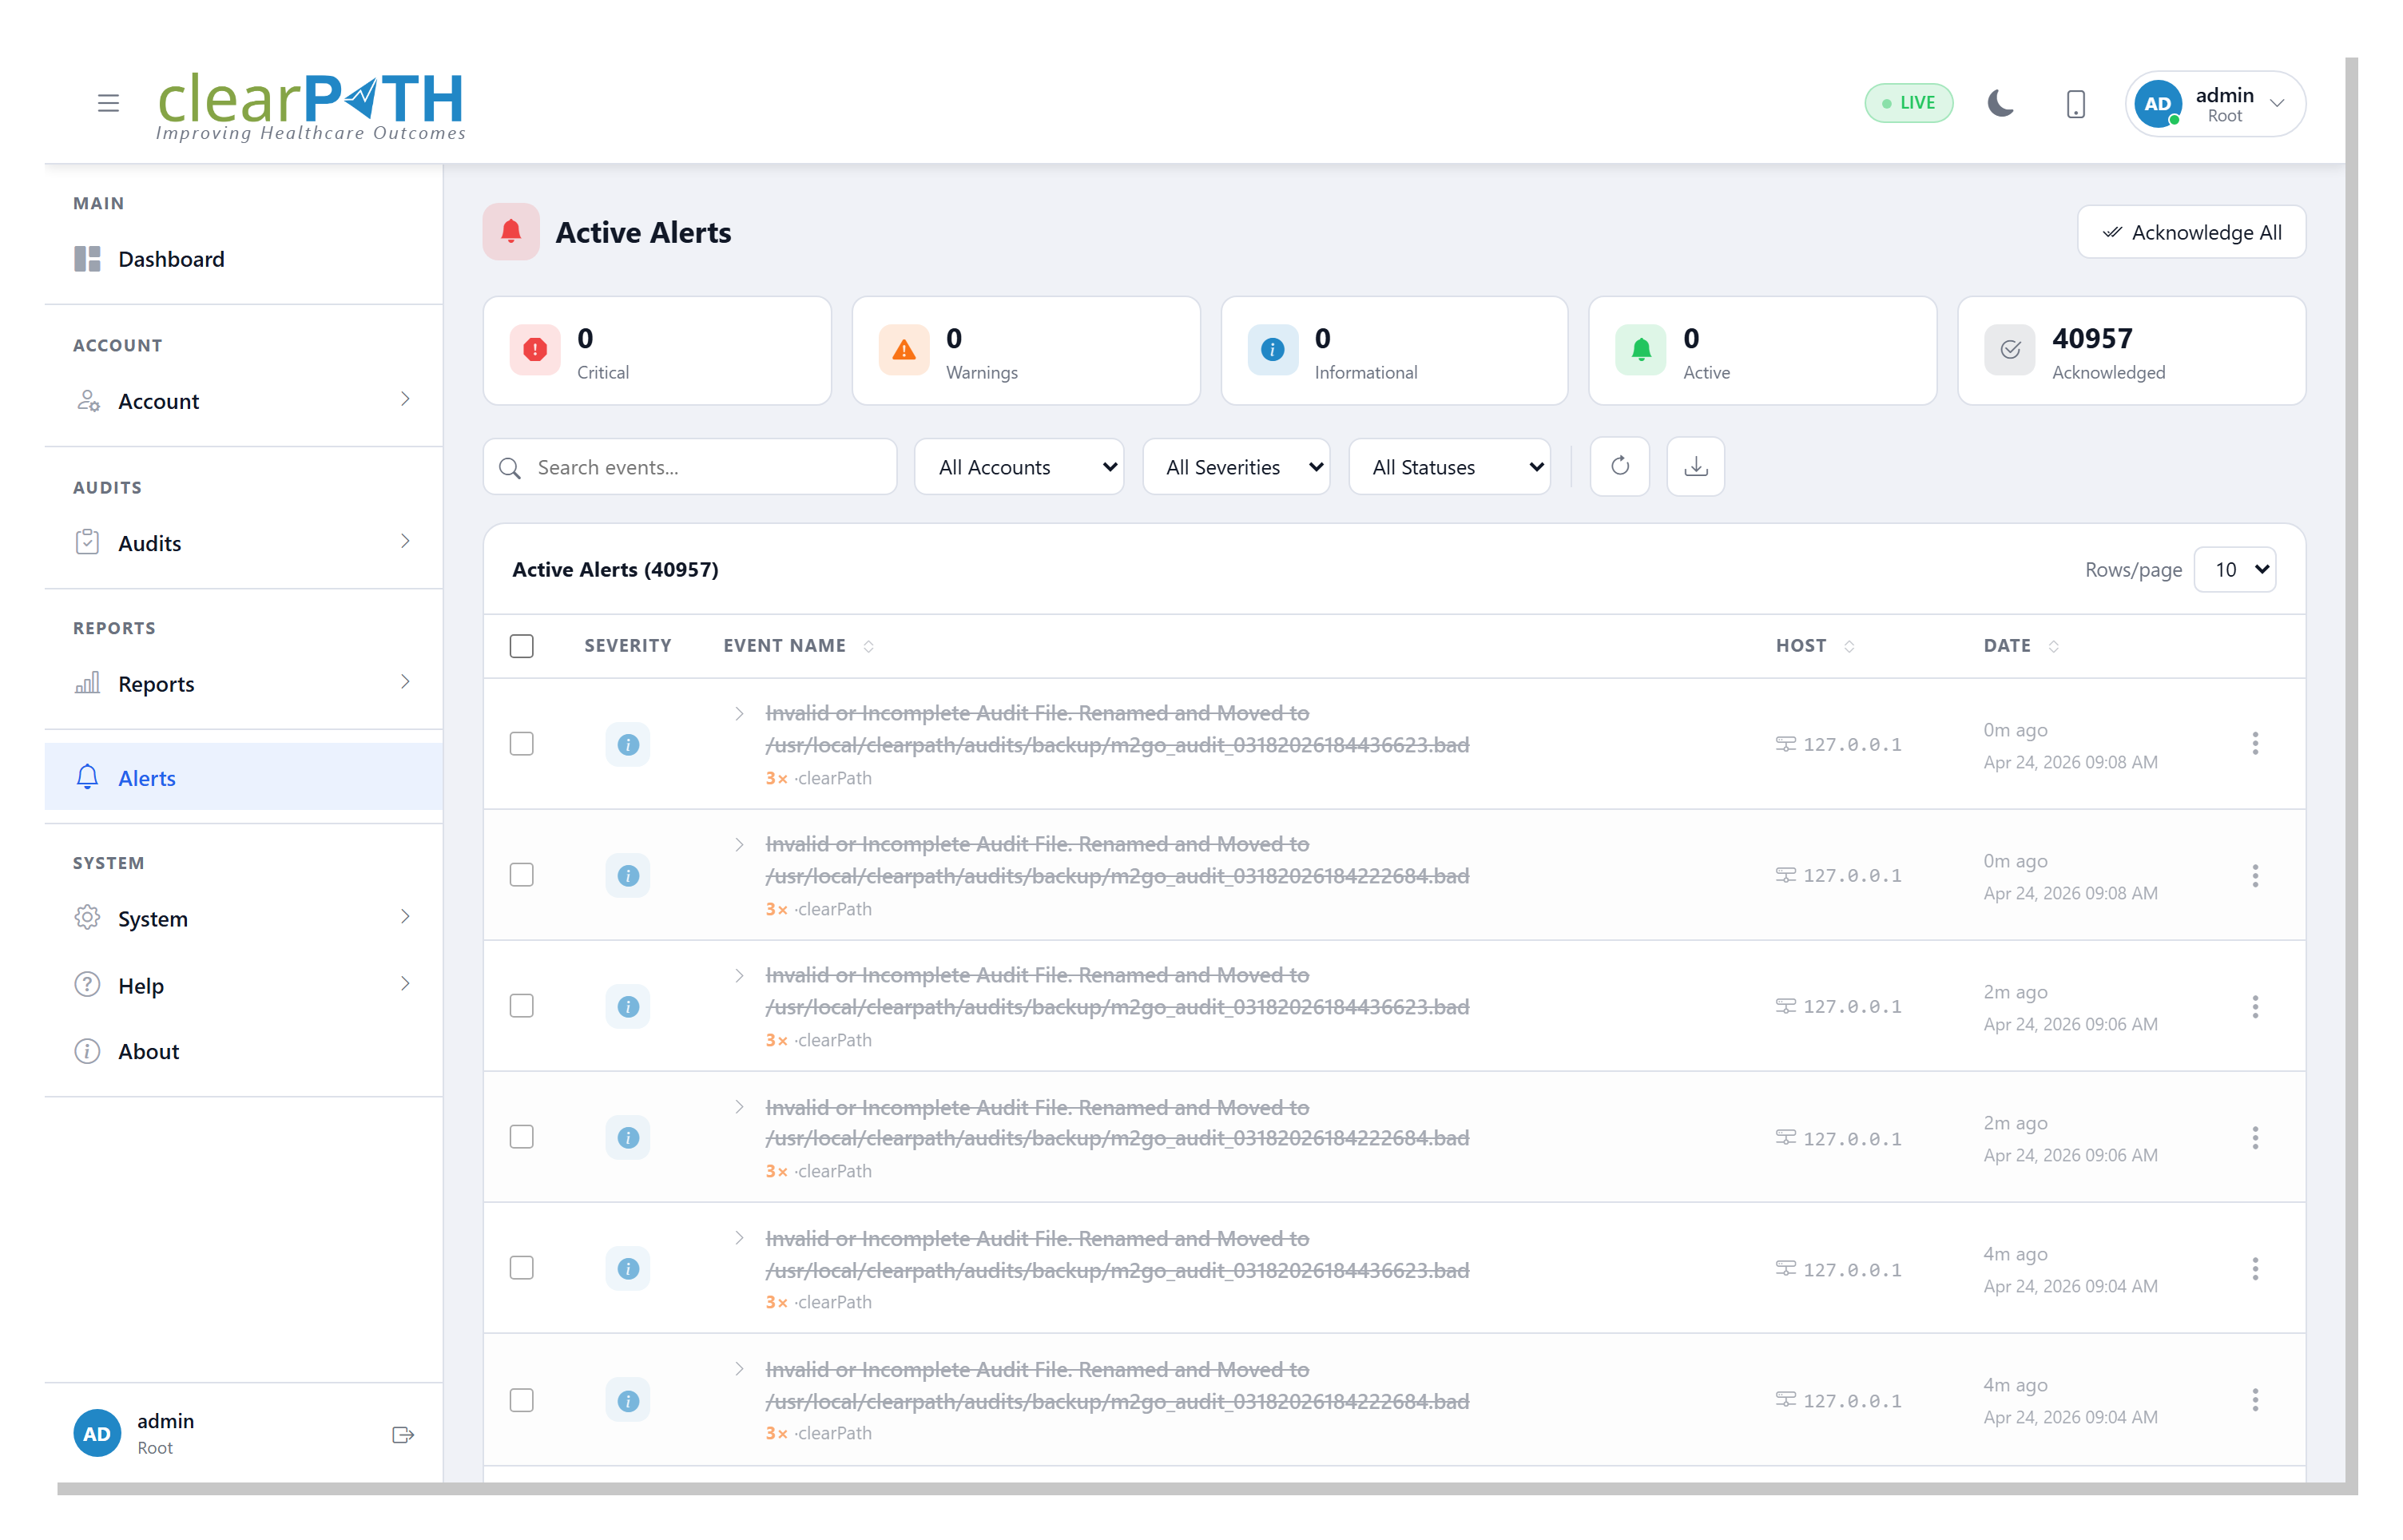
33.1. Stat Chips
Five cards across the top of the page summarise the current state of your alerts:
Critical— count of active events at critical severity.Warnings— count of active events at warning severity.Informational— count of active events at informational severity.Active— total number of events that have not yet been acknowledged.Acknowledged— total number of events that have already been acknowledged.
33.2. Toolbar
The toolbar above the table provides the following controls:
Search — filter the table by event name. The search is debounced, so results refresh shortly after you stop typing.
Account — limit the table to events from a specific account. This filter is only available to root users; administrators see their own account’s events automatically.
Severity — show one severity only. Choose from
Critical,Warning,Informational,Debug, orLog Only.Status — show only
Activeevents, onlyAcknowledgedevents, or both.Refresh — reload the table with the current filters.
33.3. Table Columns
The alerts table has the following columns:
A checkbox for selecting rows (see bulk actions below).
A severity icon whose color matches the event’s severity.
Event Name — the name of the event and its source. Click the chevron at the left of the cell to expand the row and reveal the full event detail inline (event ID, host, source, status, occurrences, timestamp, and description).
Host — the host or IP address that raised the event.
Date — a short “time ago” label with the full timestamp on the line below.
A three-dot menu for per-row actions.
33.5. Acknowledge All
The Acknowledge All button at the top right of the page
acknowledges every event that currently matches your search and
filter selections. Only the rows you can see (after filtering) are
affected — events hidden by your current filters are left alone.
33.6. Bulk Actions
Tick the checkbox on one or more rows to reveal the bulk-action bar at the top of the table. The bar shows the number of rows selected and offers:
Acknowledge— acknowledges every selected event.Delete Selected— removes every selected event after a confirmation prompt.A small close control to clear the selection without taking an action.
33.7. Event Details
Choosing View / Edit from the row menu opens the event details
dialog:
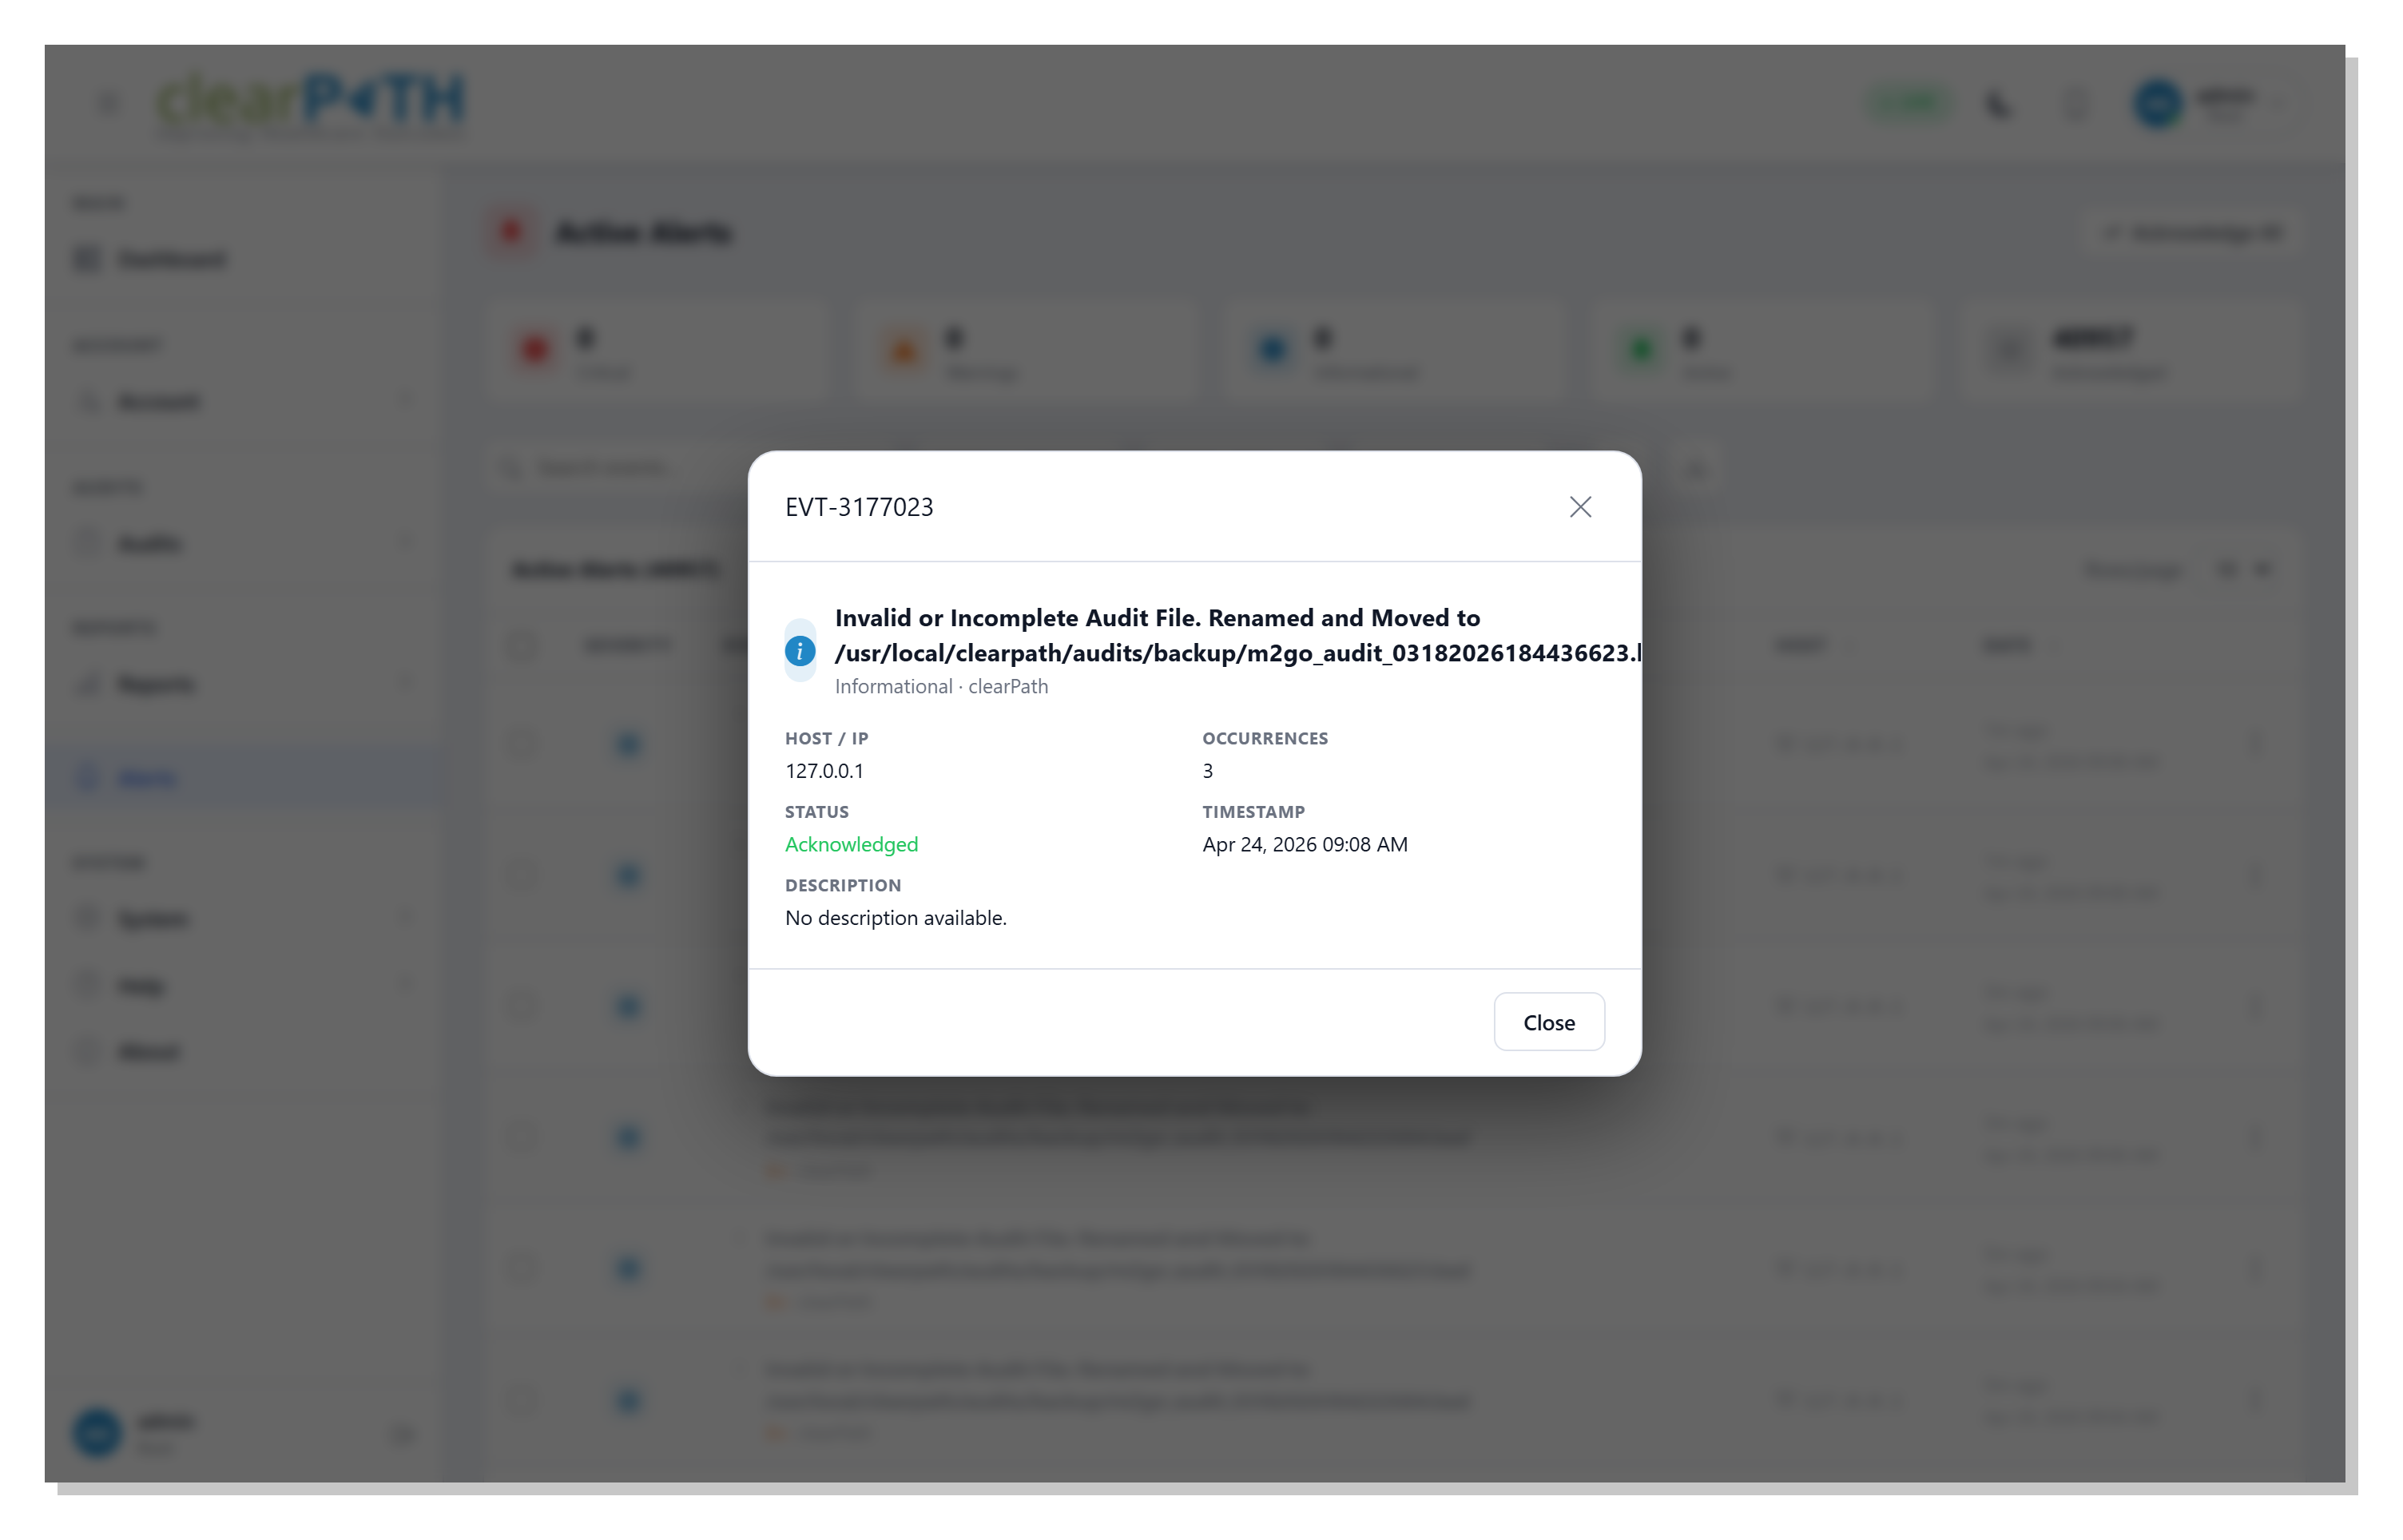
The dialog shows the event ID, severity, host, source, status,
number of occurrences, timestamp, and description. If the event has
not yet been acknowledged, an Acknowledge button lets you mark it
from here. Use Close to dismiss the dialog.
33.8. Deleting an Event
When you choose Delete from a row menu or from the bulk-action
bar, clearPath prompts you to confirm the event by ID and name before
it is removed. Deleted events are not recoverable.