10. Regions
Regions let you group corporations and facilities geographically so they can be filtered, colored, and reported on as a single unit. Typical uses are grouping facilities by continent, by Local Health Integration Network (LHIN), or by any custom region you define.
To access the Regions list click on Account | Advanced | Regions.
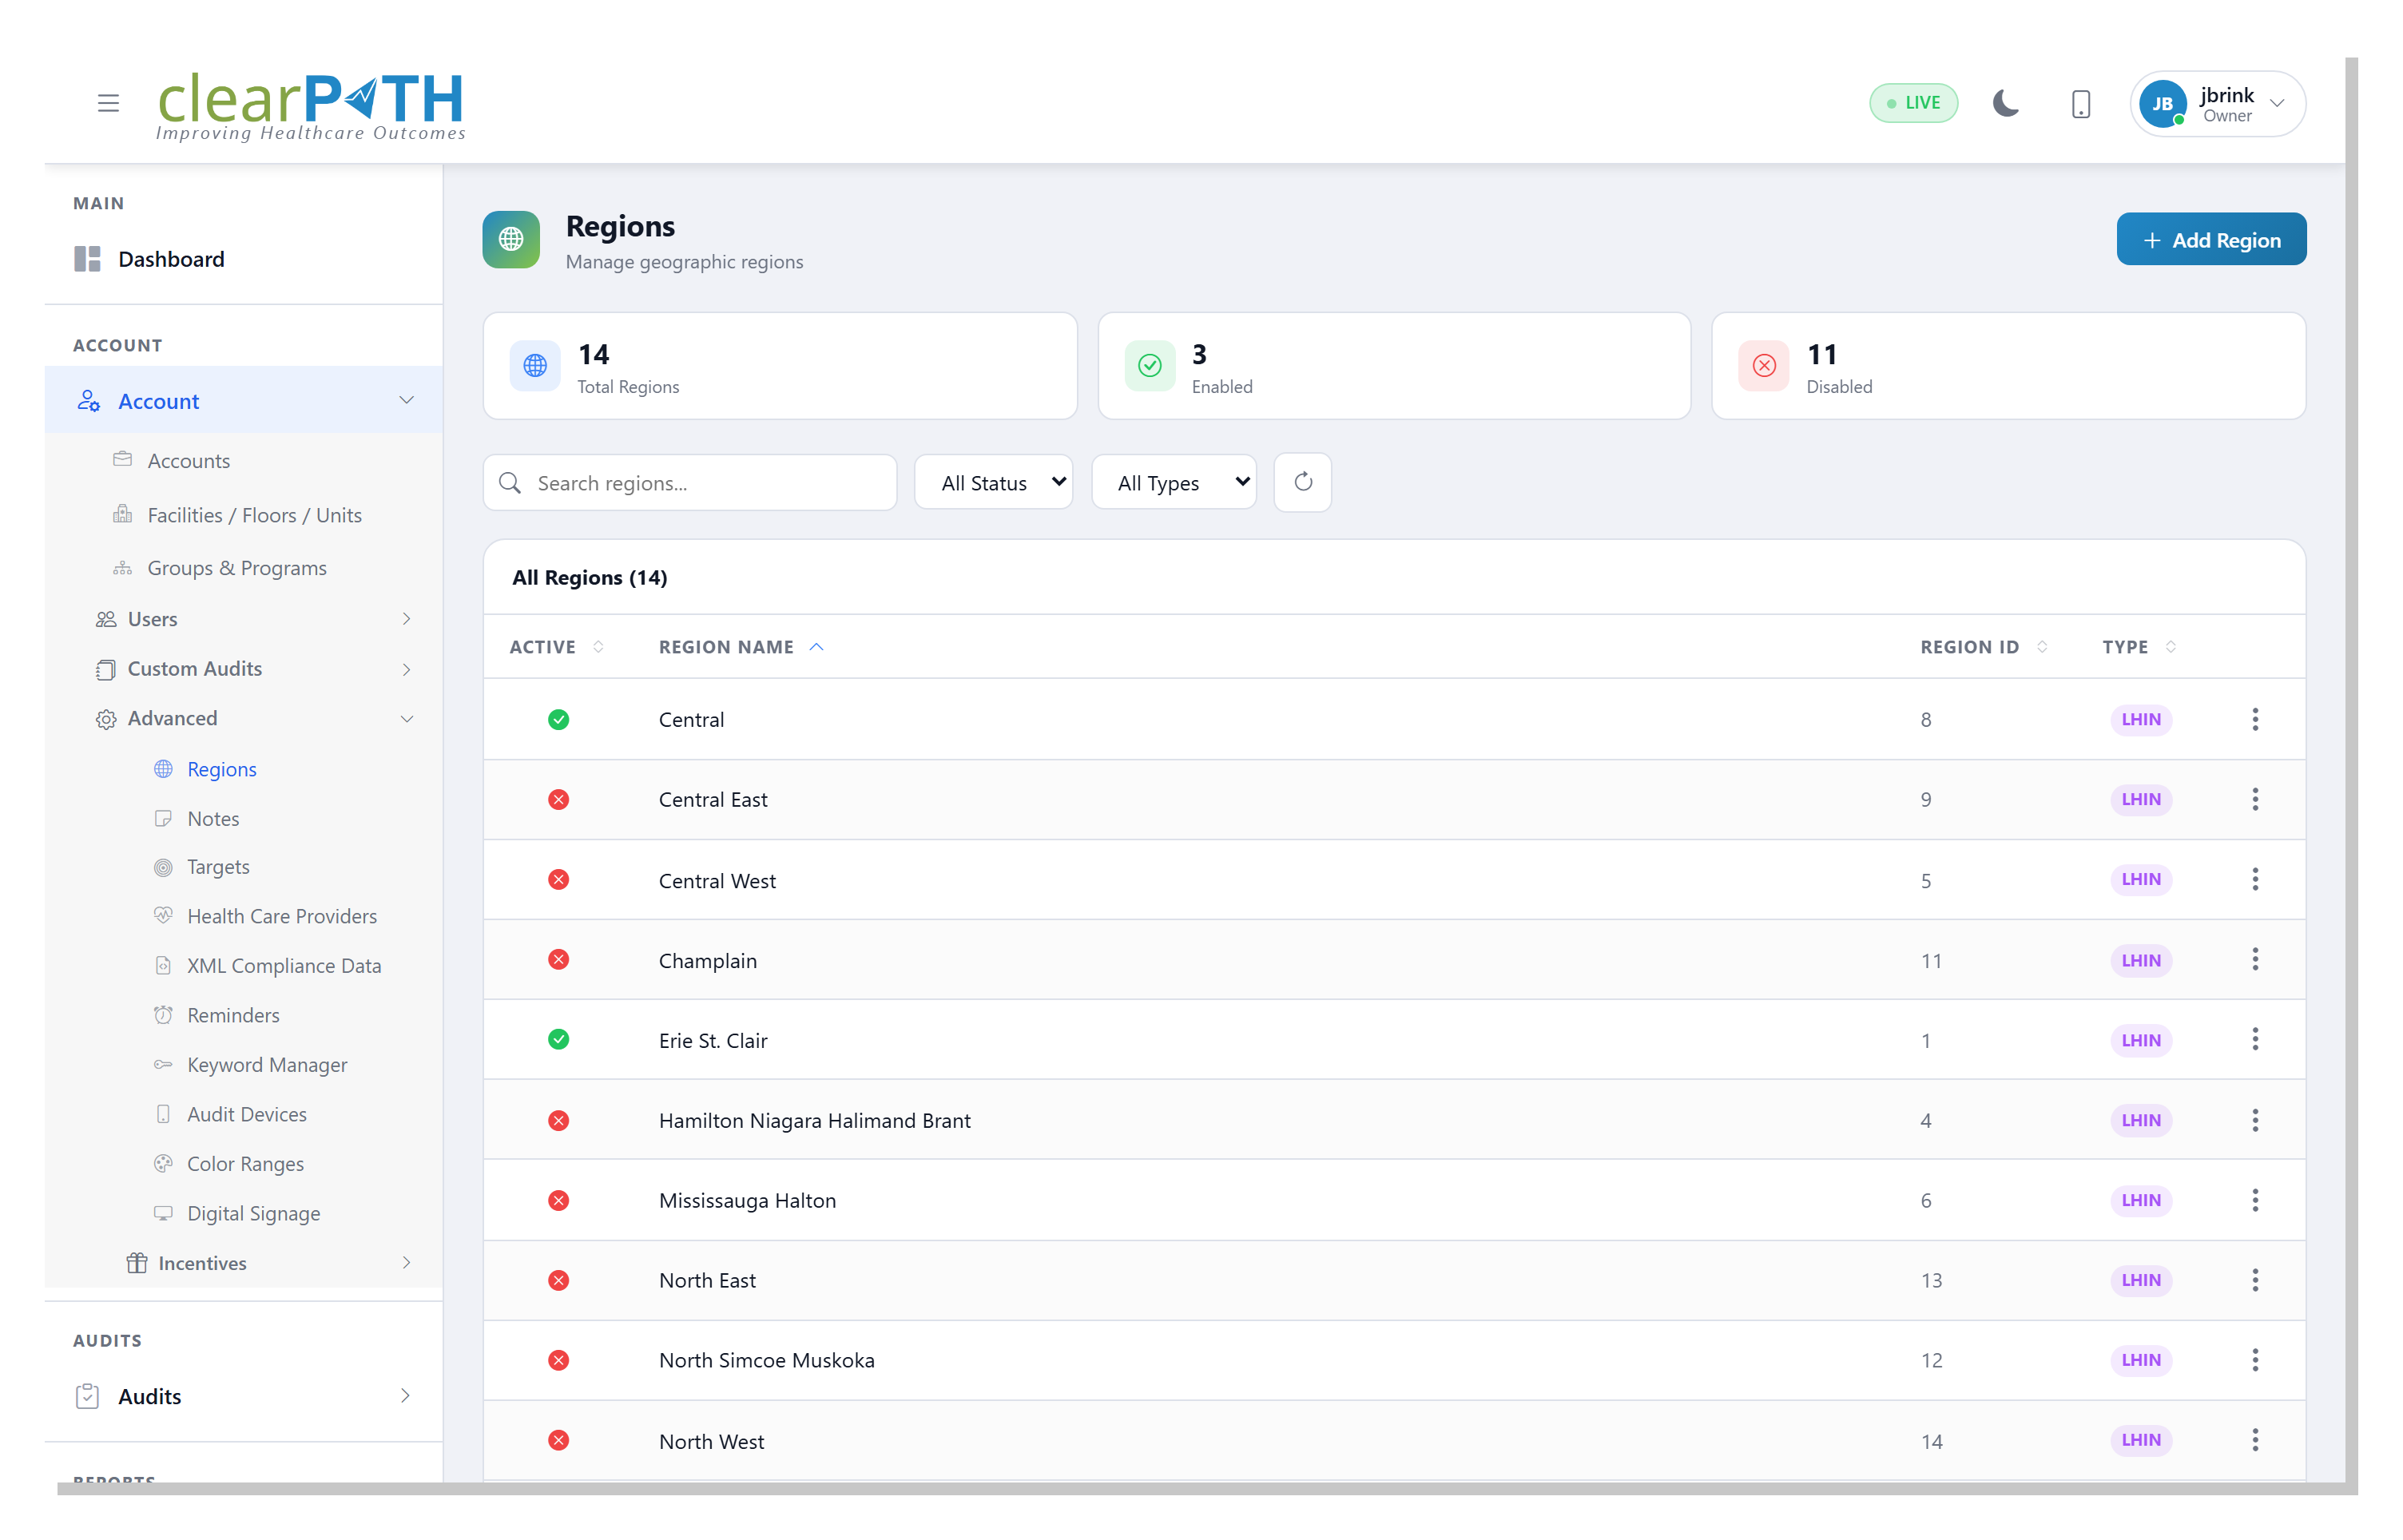
10.1. Region List
The list toolbar provides the following controls:
Search — filter the table by region name.
Status — show
Active,Inactive, or all regions.Region Type — filter by
Generic,Continent, orLHIN.Refresh — reload the table.
Click any region row to open the detail editor. Use Add Region in the top
right to create a new region.
10.2. Region Detail
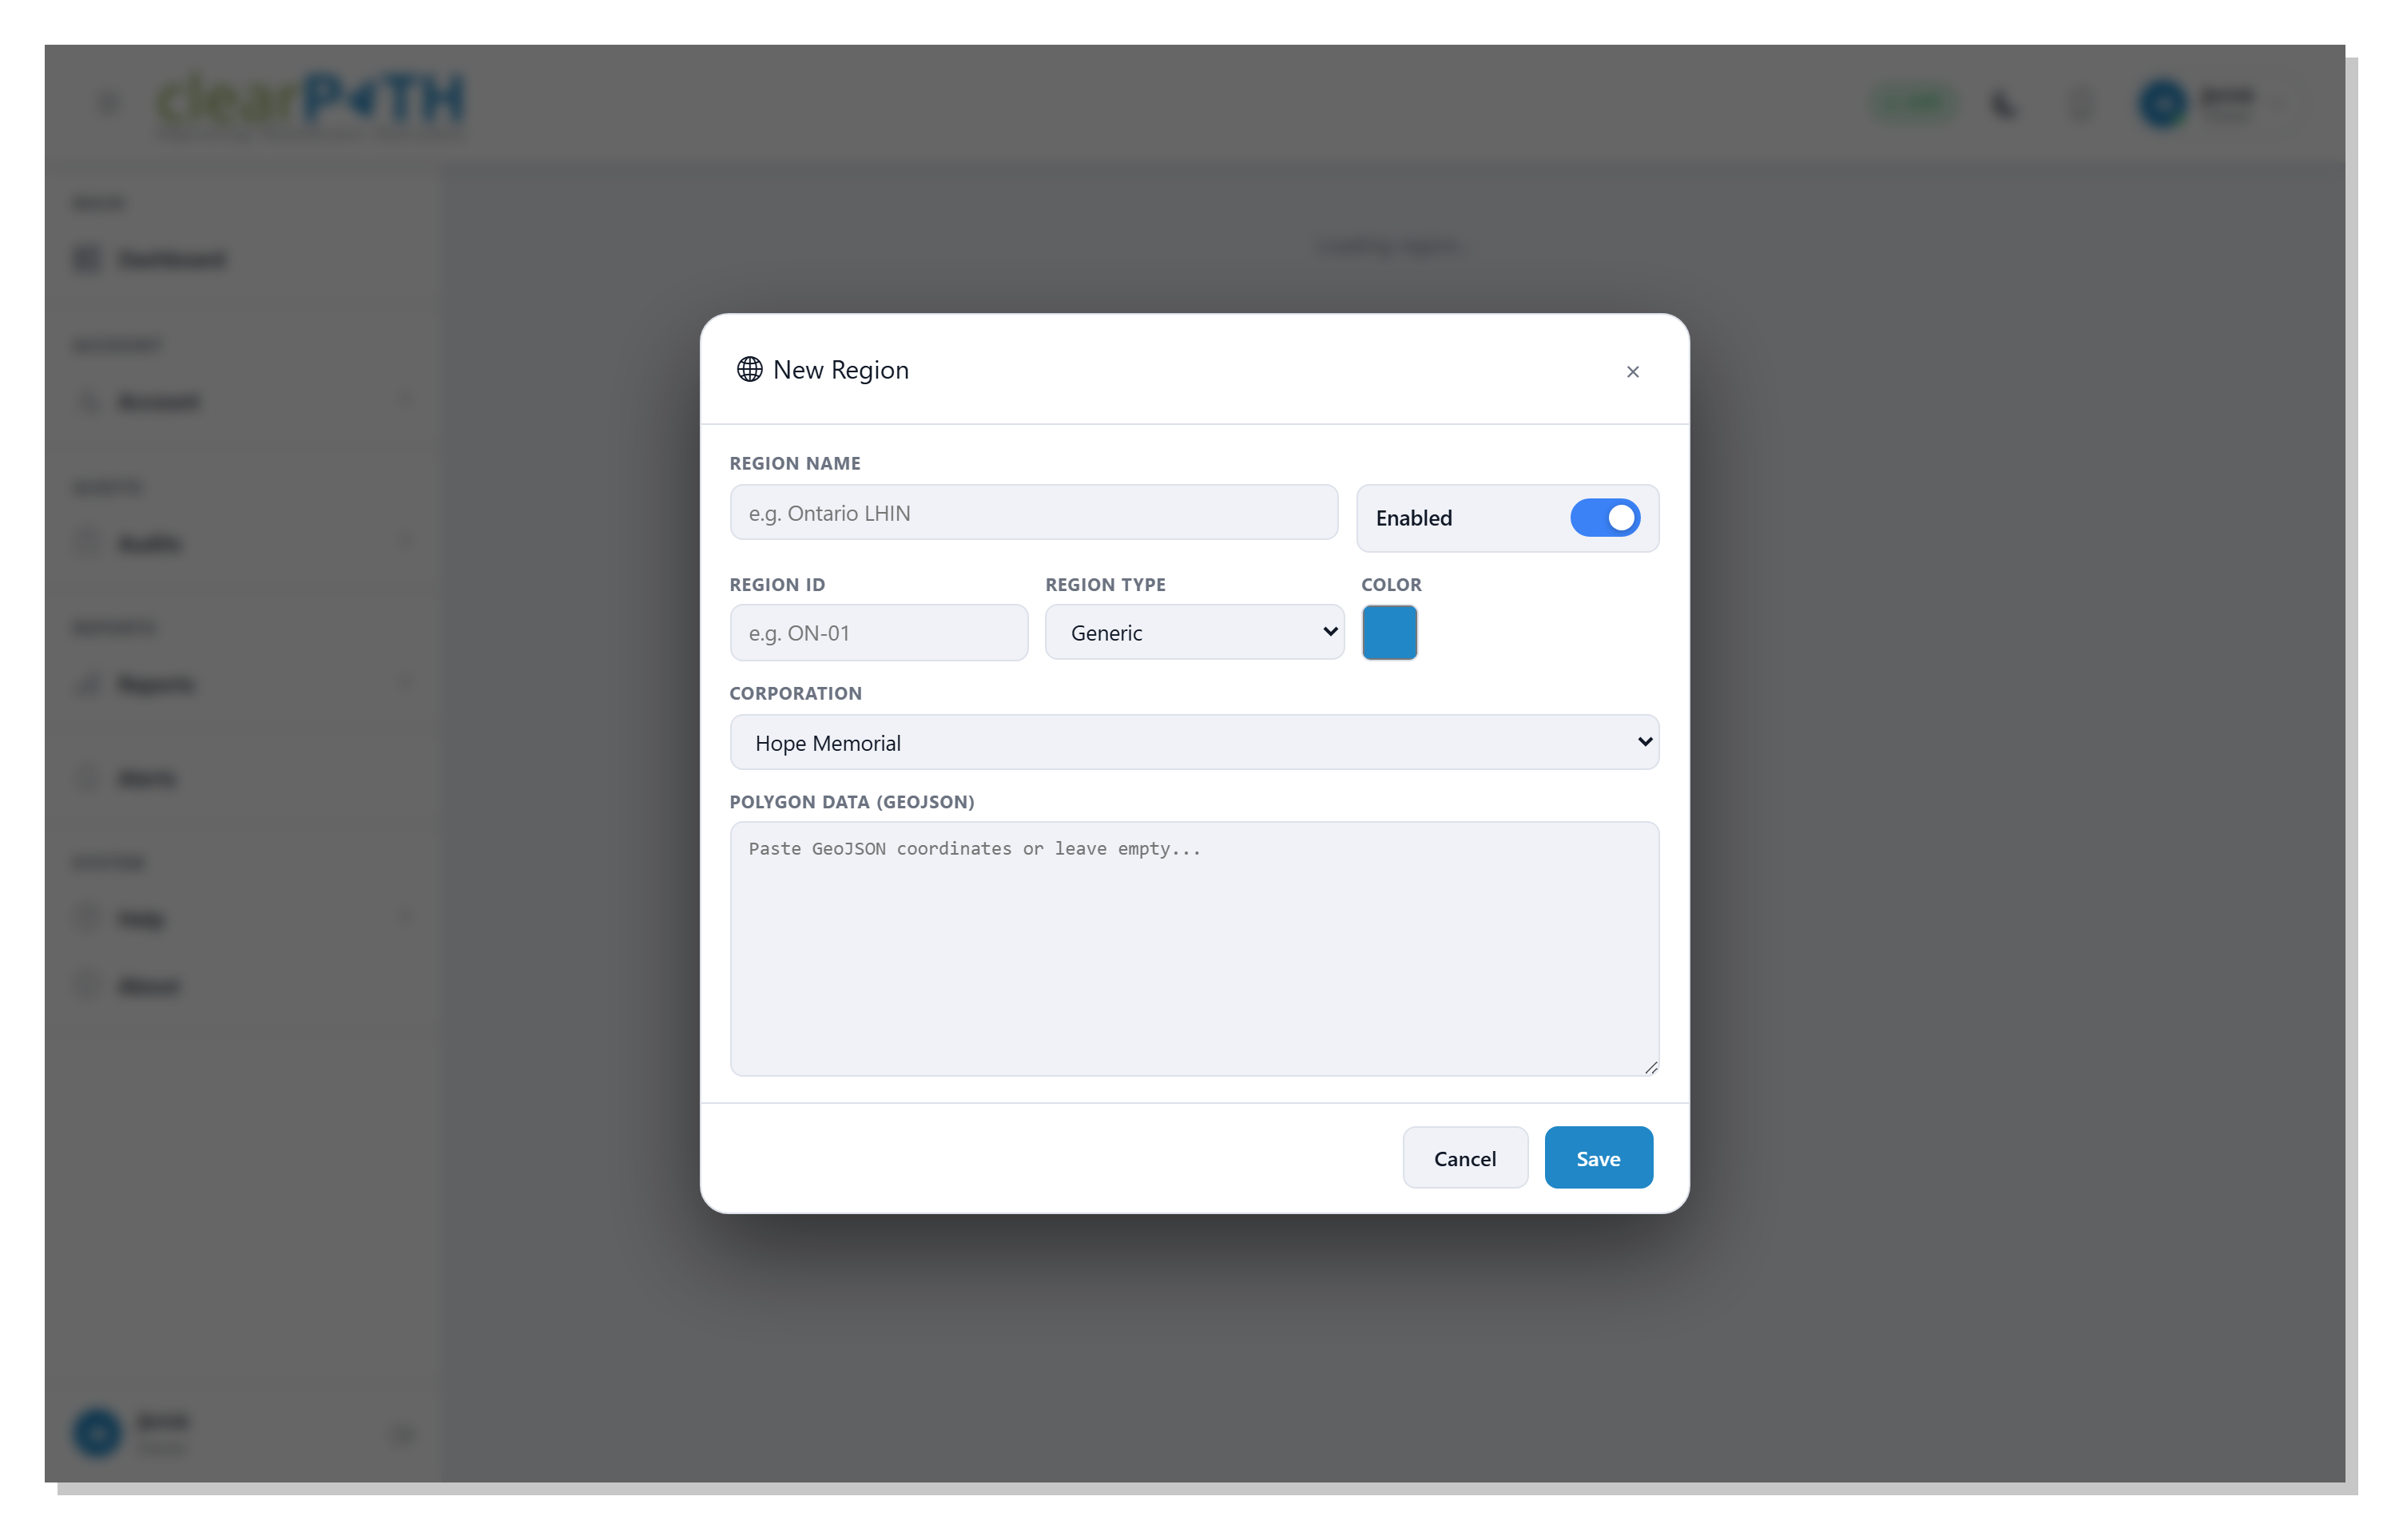
10.2.1. Region Name
A human-readable name for the region (for example, Ontario LHIN or
North America). This is the label that appears in reports and on
dashboards when facilities are grouped by region.
10.2.2. Enabled
Toggle whether this region is active. Disabled regions are hidden from filters and reporting but are not deleted.
10.2.3. Region ID
An optional short code for the region (for example, ON-01). Use this
when you want a shorter label to appear in reports, or to match an
identifier your organization already uses elsewhere.
10.2.4. Region Type
Choose the kind of region:
Generic— any custom grouping.Continent— a continental region.LHIN— a Local Health Integration Network.
The type is used by reports and dashboards that group results by geography.
10.2.5. Color
The display color assigned to the region. This color is used on the dashboard map and in any chart that colors results by region.
10.2.6. Corporation
Pick the corporation this region belongs to. Only facilities under the chosen corporation can be added to the region.
10.2.7. Polygon Data (GeoJSON)
Optional GeoJSON polygon coordinates that describe the geographic boundary of the region. When provided, the polygon is drawn on the dashboard map (dashboard) so the region is visible as a shaded area rather than a single point.
Paste the GeoJSON coordinates directly into the field, or leave empty if the region should be tracked without a visible boundary.