21. ROI Assumptions
The ROI Assumptions page is where you tune the inputs that drive the HAI Cost-Avoidance / ROI report and the four ROI widgets on the Executive dashboard. The defaults are seeded from published CDC, AHRQ, and peer-reviewed estimates so the report produces a defensible figure out of the box, but every facility’s program cost, length-of-stay cost, readmission rate, and infection-cost numbers differ. Tuning the assumptions against your own surveillance data and finance contracting figures gives you a number you can take into a budget meeting and defend line by line.
To open the ROI Assumptions page, go to Account | Advanced | ROI Assumptions.
Warning
The HAI Cost-Avoidance / ROI report is currently a preview feature and is gated by a system-wide toggle. Until an operator enables the ROI / HAI preview flag in System | Preview Features, the report will not appear in the report catalog even though the ROI Assumptions editor and the dashboard ROI widgets remain visible.
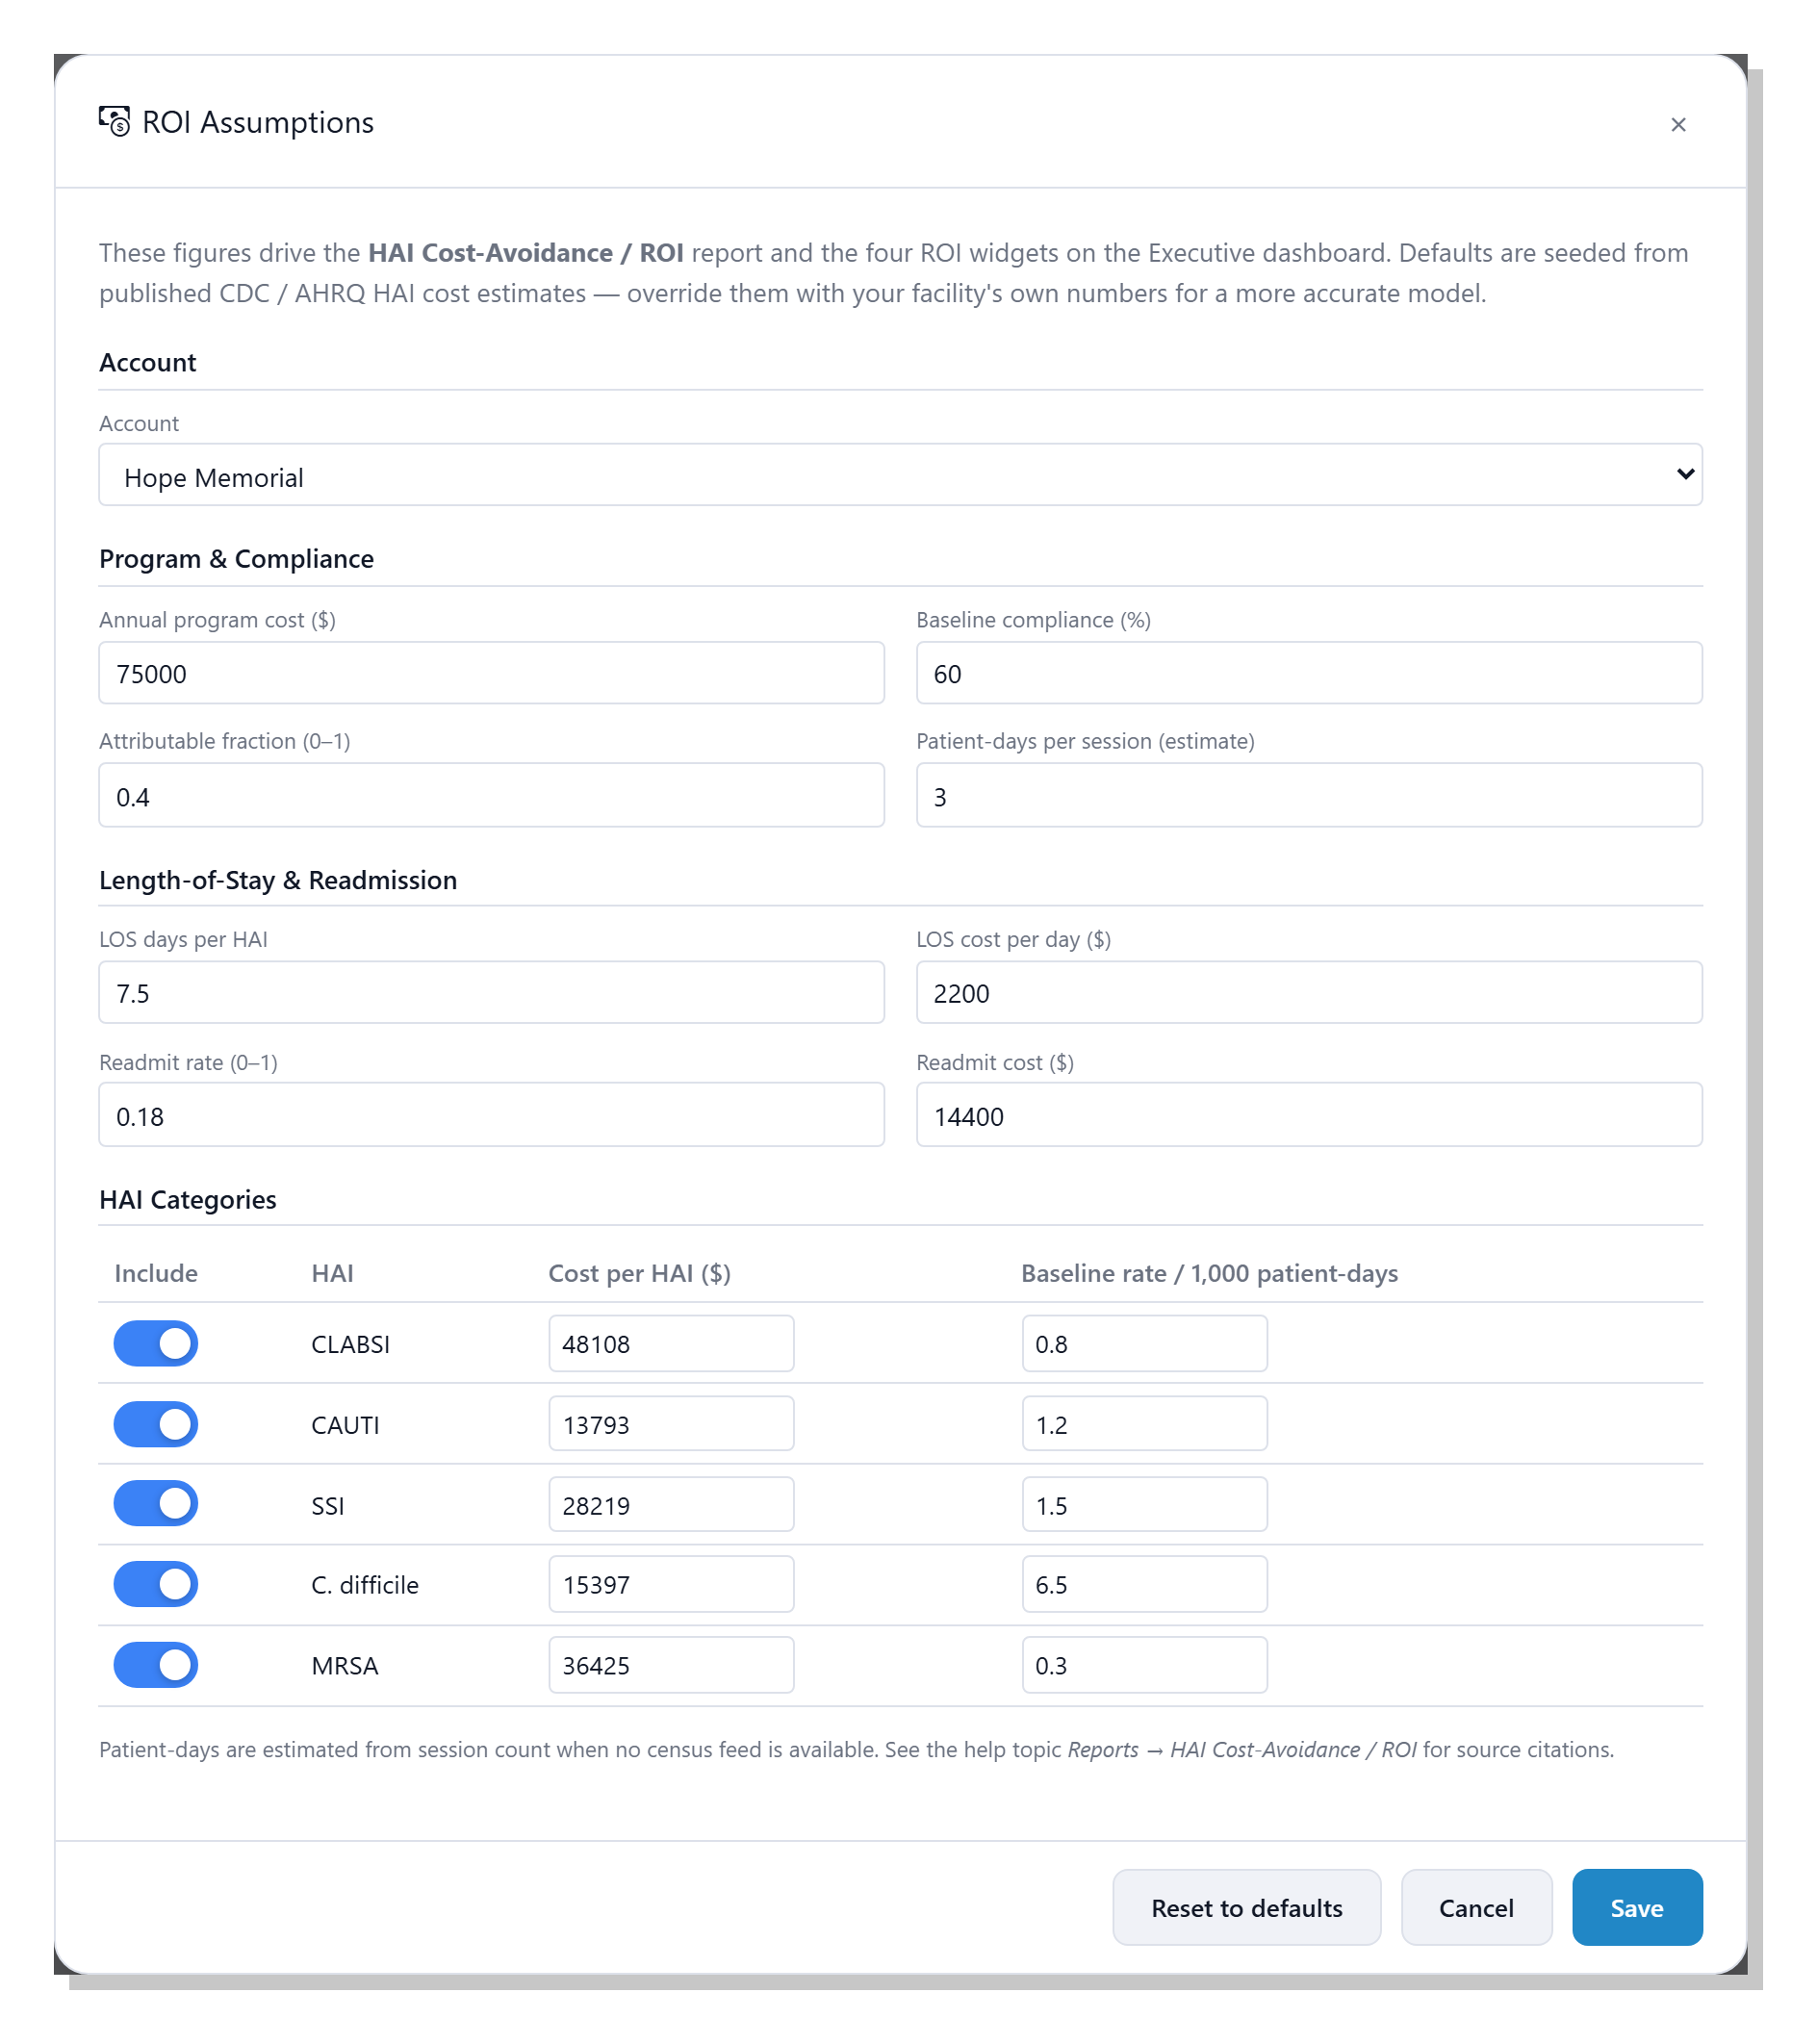
The page is a single editor dialog organised into four sections:
Account, Program and Compliance, Length-of-Stay and
Readmission, and HAI Categories. The footer carries
Reset to defaults, Cancel, and Save buttons; the
sections below explain each field, what it does in the calculation,
and where the published default comes from.
Note
The defaults shipped with clearPath are illustrative starting points, not facility-specific estimates. They are sourced from the published literature listed in References at the bottom of this page. Replacing them with your own surveillance figures, finance contracting, and infection-prevention program cost produces a far more credible model — and is expected.
21.1. Account
The account dropdown at the top of the form selects which account’s assumptions you are editing. System users see every account in the list and can pick any one; account administrators see their own account already selected, with the dropdown locked. Switching the dropdown reloads the form with that account’s saved values; if an account has no overrides, the published defaults are shown until you save.
21.2. Program and Compliance
This section captures the inputs that turn a compliance lift into a number of infections avoided. The four fields together drive the core multiplier in the ROI model.
21.2.1. Annual program cost ($)
The all-in cost of running clearPath at this account for one year — the licence fee plus the staff time, training, and any auxiliary hardware. This figure is prorated to the report period (for example, a 90-day report uses roughly a quarter of the annual cost) and subtracted from the gross savings to give the net savings figure on the ROI report.
The default is $75,000, picked as a mid-range illustrative
number; replace it with your own contracted licence cost plus any
internal time you can attribute to running the program.
21.2.2. Baseline compliance (%)
The hand hygiene compliance level you measure improvement against.
The ROI calculation only counts compliance gains above this
baseline; anything observed at or below the baseline produces zero
avoided HAIs. The default is 60 %, drawn from large multi-centre
hand hygiene observational studies that consistently report
pre-intervention compliance in the 40–60 % range [1]
[2].
Tip
Pick a baseline that is defensible to your finance partners — a pre-program audit, a published industry average, or your own compliance from the year before clearPath was deployed. A conservative baseline gives a smaller but more credible ROI number; an aggressive one looks impressive but is easy to challenge.
21.2.3. Attributable fraction (0–1)
The share of the relevant HAIs that improved hand hygiene can
plausibly prevent. The default is 0.40 (40 %), in line with
published estimates of the contribution of hand hygiene compliance
to HAI prevention [3] [4]. Lowering this
number makes the model more conservative.
Note
The WHO and several authors have used figures as high as 50 % in campaign materials, but more conservative analyses settle in the 30–40 % range. clearPath ships at 40 % to land squarely in the middle of the published evidence.
21.2.4. Patient-days per session (estimate)
clearPath does not collect census feeds, so the model estimates
patient days from the count of audit sessions in the period. The
default multiplier is 3.00, meaning one audit session represents
roughly three patient days of clinical activity. Tune this against
your own sampling pattern if you can — if your auditors round
typically two patients per session, drop the multiplier; if they
walk an entire wing, raise it.
21.3. Length-of-Stay and Readmission
When an HAI is avoided, the savings extend past the cost of the infection itself — the patient leaves the hospital sooner and is less likely to come back. The four fields in this section capture both effects.
21.3.1. LOS days per HAI
The average number of additional inpatient days a patient stays when
they acquire an HAI, across all HAI types. Multiplied by LOS cost
per day and the number of HAIs avoided to give the length-of-stay
savings component of the ROI.
The default is 7.5 days, near the midpoint of the 4–15 day range
reported across HAI types in CDC and AHRQ analyses
[5] [6].
21.3.2. LOS cost per day ($)
The dollar cost to your facility of one extra inpatient day,
including bed, staffing, supplies, and overhead. The default is
$2,200, in line with published all-payer estimates of average
US inpatient day costs [7]. Use your own contracting
or finance figure where possible — this is one of the easiest
levers to defend with internal data.
21.3.3. Readmit rate (0–1)
The fraction of HAI patients who are readmitted within the
post-discharge window your facility tracks. The default is 0.18
(18 %), close to the all-cause 30-day Medicare readmission rate
historically reported by CMS [8]; HAI-specific
readmissions are typically a few points higher again.
21.3.4. Readmit cost ($)
The dollar cost of one readmission. The default is $14,400,
based on published mean readmission costs across major HAI categories
[9]. Again, replace with your own finance figure
where you have one.
21.4. HAI Categories
The HAI Categories table covers the five infection types responsible
for the bulk of attributable HAI cost in US hospitals. Each row has
an Include toggle, the cost per case, and the baseline incidence
rate per 1,000 patient-days. Disable a category when your facility
does not track it, or when you prefer to leave it out of the figure
for credibility reasons (for example, an outpatient surgical centre
might disable C. difficile and CAUTI).
CLABSI— central line-associated bloodstream infection.CAUTI— catheter-associated urinary tract infection.SSI— surgical site infection.C. difficile— Clostridioides difficile infection.MRSA— methicillin-resistant Staphylococcus aureus infection.
The baseline rate is expressed per 1,000 patient-days, so an entry
of 0.80 means the model assumes an average of 0.8 CLABSI events
per 1,000 patient-days of clinical activity in the absence of any
hand hygiene improvement.
The shipped defaults are drawn from peer-reviewed cost-of-infection work and the CDC’s National Healthcare Safety Network surveillance reports:
Cost per case defaults are drawn from the consensus meta-analysis by Zimlichman et al. [9], which is the most widely cited single source for HAI cost in the US context and is used by AHRQ in its HAI program materials.
Baseline incidence rates are aligned with the CDC’s NHSN Annual HAI Progress Reports [10], scaled to a per-1,000- patient-day basis.
Tip
Cite your source. The defaults above come from CDC, AHRQ, and peer-reviewed estimates and are reasonable starting points, but a finance partner will respect a number that points back to your own surveillance data or a named published source. If you do override a default, jot the source down in your finance binder alongside the new figure.
21.5. Saving and Resetting
Save— writes the current form values back to the selected account. The next report run and the next dashboard refresh pick up the new figures.Reset to defaults— clears any account-specific overrides for the selected account so that the next load falls back to the published defaults seeded at install time. The form is repopulated with those defaults immediately.Cancel— closes the dialog without saving.
Note
Patient-days are an estimate when no census feed is available.
Where a facility provides census data, replacing the estimate
with real patient-day counts produces a more accurate
cost-avoidance figure. Until then, the Patient-days per
session multiplier is the best lever to tune for your sampling
pattern.
21.6. References
The published sources behind the shipped defaults are listed below. None of these are paywalled — each is freely available through the linked publisher, CDC, AHRQ, or PubMed.